Plotting a lot of data can be awfully slow. Let’s render plots in a
job so that we kan keep working in the meantime. To
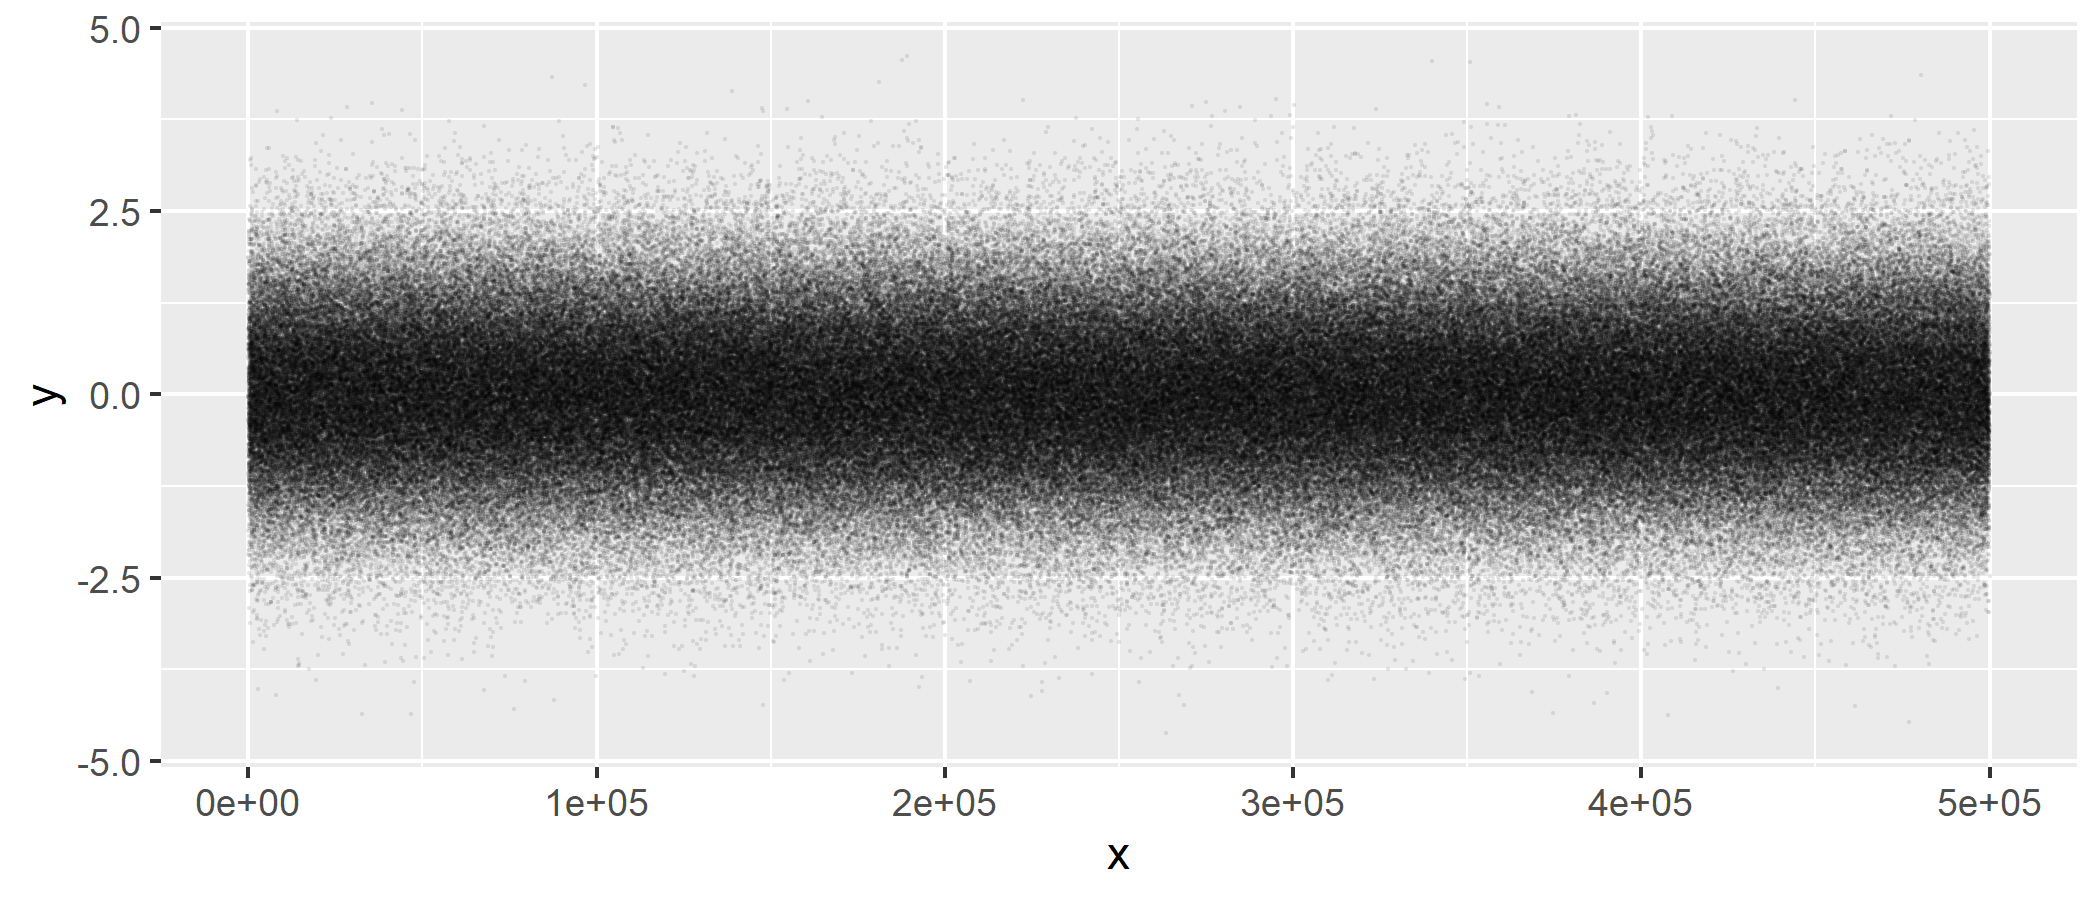
demonstrate, here’s a simple dataset with 500k rows which takes 10+
seconds to render:
n = 5e5
df = data.frame(x = seq_len(n), y = rnorm(n))
Render a ggplot2
ggplot2 is fast at building the plot “grammar” but
rendering can be slow. So let’s build the plot in our main session but
offload the rendering to a job::job(). We need to render it
to a file because the job has no viewer.
# Build plot "grammar"
library(ggplot2)
gg = ggplot(df, aes(x = x, y = y)) +
  geom_point(size = 0.1, alpha = 0.05)

# Render in a job
job::job({
  ggsave("gg_points.png", plot = gg, width = 7, height = 3)
})