
Run example models
Arguments
- name
Name of the example. One of:
"ar": One change point in autoregressive residuals (thear1dpar)"binomial": Binomial with two change points. Much like"demo"on a logit scale."demo": Two change points between intercepts and joined/disjoined slopes."group_mu": Group-level deviations in the predictor part (random intercepts/slopes) across a change point."group_cp": Group-level change-point deviations (random effects)."intercepts": An intercept-only change point."missing": Missing data imputation (NAs in response variable y)."multiple": Multiple regression with categorical predictors and interactions."sigma": A change in "sigma" dpar, including a slope on sigma."void": Missing data around change points.
- sample
One of
"post": Sample the posterior."prior": Sample only the prior. Useprior = TRUEexplicitly in plots, summaries, and other methods to select prior draws."both": Sample both prior and posterior. Plots, summaries, etc. will default to using the posterior. Useprior = TRUEto select prior draws."none"orFALSE: Do not sample. Returns an mcpfit object without draws (an "empty fit"). This is useful if you only want to check prior strings (fit$prior), the JAGS model (fit$jags_code), etc.
- plot
Logical. Plot the fitted example? Requires sample != "none".
Value
An mcpfit, enriched with an $example_code field. It contains the code to
reproduce the data and the fit.
Author
Jonas Kristoffer Lindeløv jonas@lindeloev.dk
Examples
# \donttest{
fit = mcp_example("multiple")
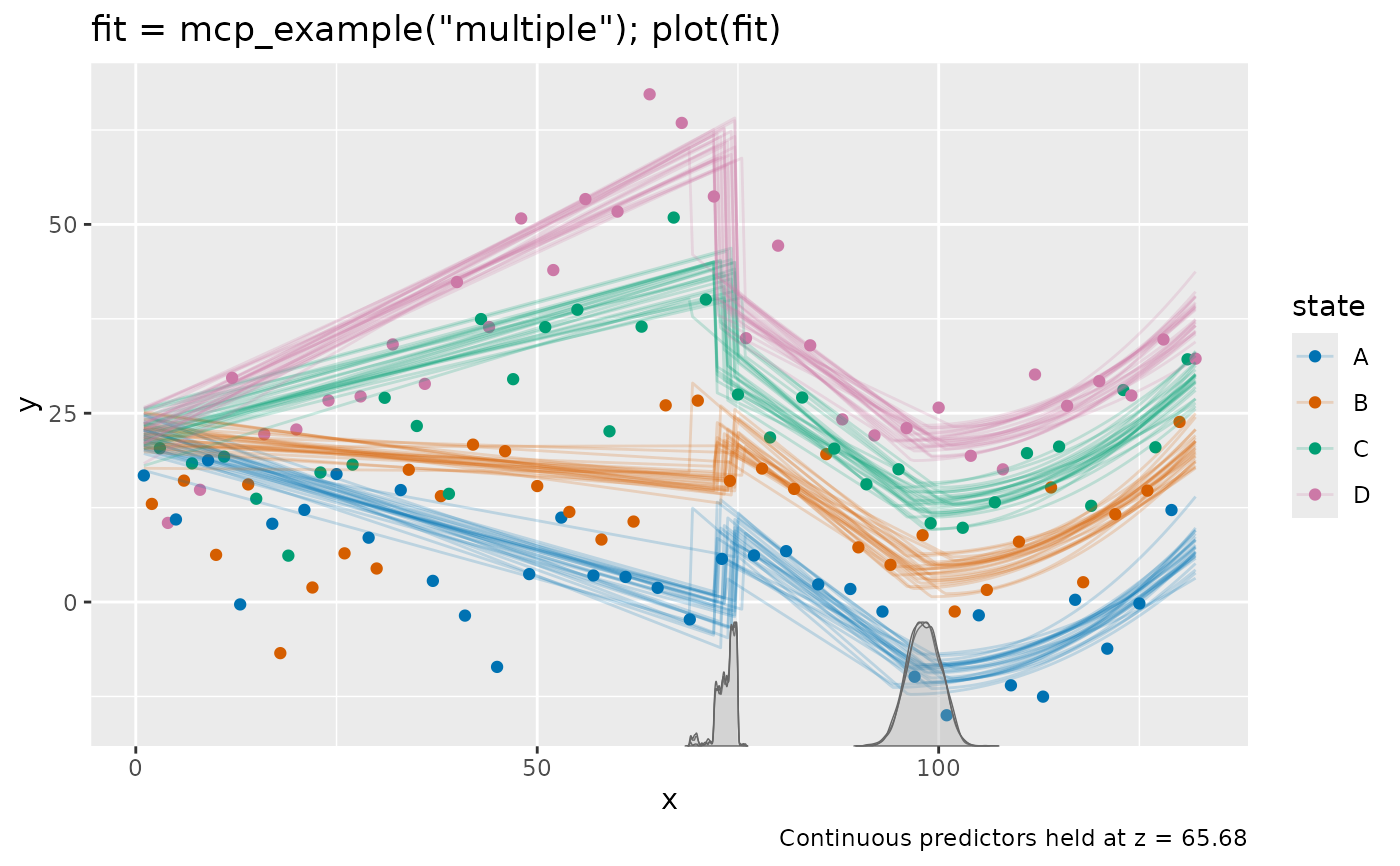 print(fit$example_code) # See how the data was simulated
#> # mcp_example() arguments
#> sample = "post"
#> plot = TRUE
#>
#> # Define model
#> model = list(
#> y ~ 1 + x:state + z, # Intercept_1, by-state slopes (x.stateA_1, ...), z_1
#> ~ 1 + x + state, # At cp_1: Disjoined (Intercept_2, x_2, stateB_2, ...); z not included
#> ~ 0 + I(x^2) + same(state) # At cp_2: Joined quadratic (xE2_3); reuse stateB_2, ...
#> )
#>
#> # Simulate data
#> set.seed(42)
#> data = data.frame(
#> x = 1:132,
#> state = rep(c('A', 'B', 'C', 'D'), 33),
#> z = rnorm(132, mean = 1:132, sd = 25),
#> y = 2. # or whatever signals 'numeric'. Will be replaced by simulation below.
#> )
#> empty = mcp(model, data, sample = FALSE, par_x = 'x')
#> data$y = empty$simulate(empty, data,
#> cp_1 = 70,
#> cp_2 = 100,
#>
#> Intercept_1 = 10,
#> z_1 = 0.2,
#> x.stateA_1 = -0.30,
#> x.stateB_1 = -0.10,
#> x.stateC_1 = 0.25,
#> x.stateD_1 = 0.50,
#>
#> Intercept_2 = 15,
#> x_2 = -0.8,
#> stateB_2 = 10,
#> stateC_2 = 20,
#> stateD_2 = 30,
#>
#> xE2_3 = 0.02,
#>
#> sigma_1 = 5
#> )
#>
#> # Run sampling
#> fit = mcp(model, data, par_x = 'x', sample = sample, seed = 42)
#>
#> # Illustrative plot
#> if (plot) {
#> set.seed(42)
#> print(plot(fit) + ggplot2::labs(title = 'fit = mcp_example("multiple"); plot(fit)'))
#> }
# Without sampling
empty = mcp_example("binomial", sample = "none", plot = FALSE)
print(empty)
#> Family: binomial
#> Links: mu = logit
#> Segments:
#> 1: y | trials(N) ~ 1
#> 2: ~ 0 + x
#> 3: ~ 1 + x
#>
#> No posterior draws. Nothing to summarise.
print(empty$example_code)
#> # mcp_example() arguments
#> sample = "none"
#> plot = FALSE
#>
#> # Define model
#> model = list(
#> y | trials(N) ~ 1, # Plateau (Intercept_1): constant success probability
#> ~ 0 + x, # At cp_1: Joined slope (x_2) on the logit scale
#> ~ 1 + x # At cp_2: Disjoined slope (Intercept_3, x_3)
#> )
#>
#> # Simulate data
#> set.seed(42)
#> data = data.frame(
#> x = 1:100,
#> N = base::sample(15:25, 100, replace=TRUE),
#> y = 0. # Numeric placeholder that is valid for every sampled trial count.
#> )
#> empty = mcp(model, data, family = binomial(), sample = FALSE)
#> data$y = empty$simulate(empty, data,
#> cp_1 = 30,
#> cp_2 = 70,
#> Intercept_1 = 1.5,
#> Intercept_3 = -1,
#> x_2 = -0.15,
#> x_3 = 0.05
#> )
#>
#> # Run sampling
#> fit = mcp(model, data, family = binomial(), sample = sample, seed = 42)
#>
#> # Illustrative plot
#> if (plot) {
#> set.seed(42)
#> print(plot(fit, interval = "fitted") + ggplot2::labs(title = 'fit = mcp_example("binomial"); plot(fit, interval = "fitted")'))
#> }
# Now sample this model
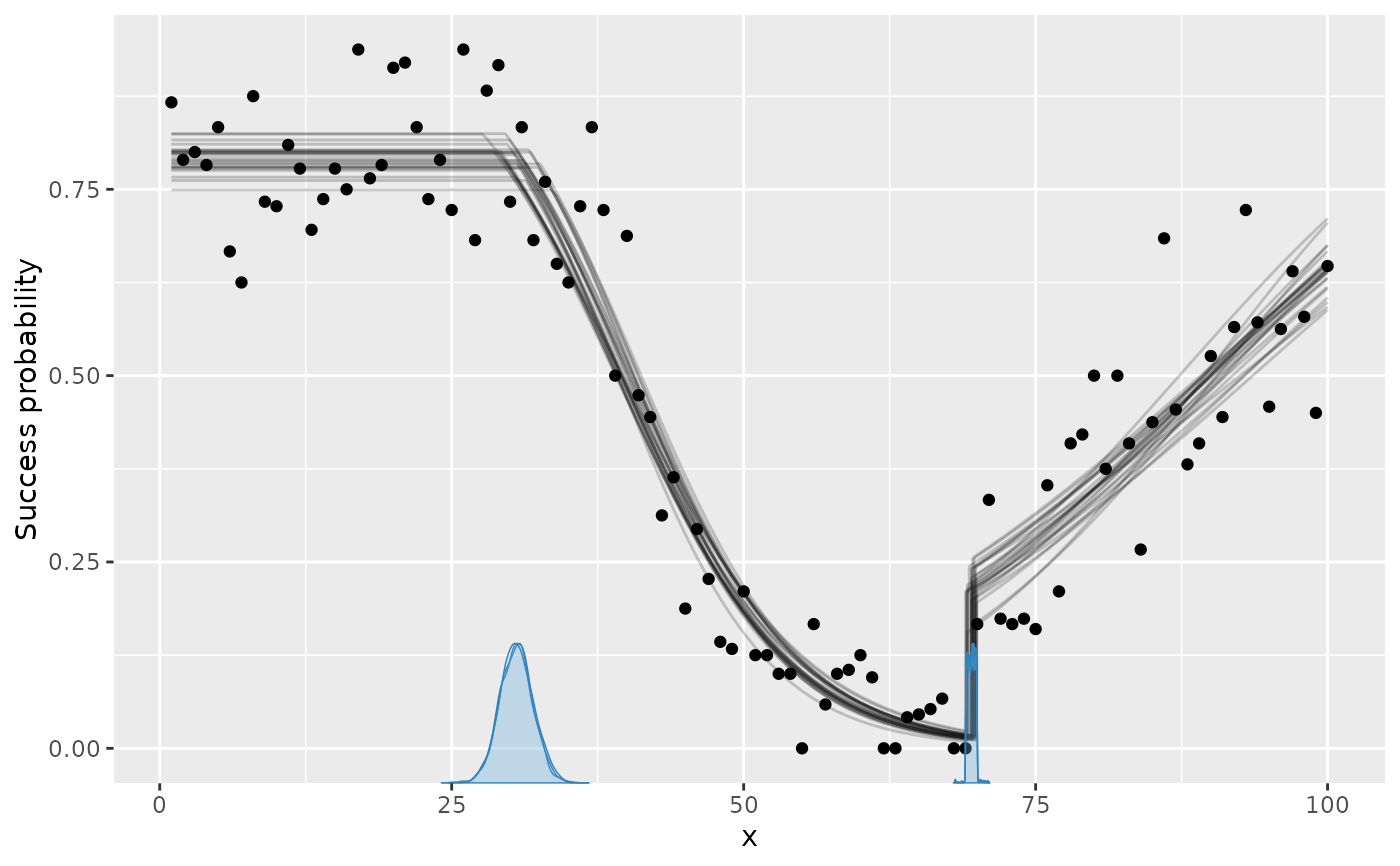
fit2 = mcp(empty$model, empty$data, family = empty$family, seed = 42)
plot(fit2)
 # }